What is Power BI?
Power BI is Microsoft's flagship business intelligence platform that transforms your raw data into meaningful insights through interactive visualizations and comprehensive reports.
As a cloud-based analytics service, Power BI enables you to connect to hundreds of data sources, simplify data preparation, and drive ad-hoc analysis. Share your insights across your organization through dashboards and reports that work across all devices.
Unified Data View
Connect to multiple data sources and create a single source of truth for your organization
AI-Powered Insights
Leverage built-in AI capabilities to discover hidden patterns and predict future trends
Real-Time Collaboration
Share dashboards and reports securely across your organization in real-time
Power BI
EcosystemPowerful Features at Your Fingertips
Discover the comprehensive suite of tools that make Power BI the world's leading business intelligence platform
Universal Data Connectivity
Connect to over 150 data sources including SQL databases, Excel, cloud services, web APIs, and more.
- Direct database connections
- Cloud platform integration
- Real-time streaming data
- REST API connectivity
Interactive Visualizations
Create stunning, interactive visuals with drag-and-drop simplicity using our extensive library of custom visuals.
- 100+ built-in visuals
- Custom visual development
- Cross-filtering capabilities
- Drill-down analysis
AI & Machine Learning
Leverage built-in AI capabilities to automatically discover insights and predict future trends from your data.
- Quick Insights
- Key influencers analysis
- Anomaly detection
- Forecasting models
Advanced Data Modeling
Build sophisticated data models with relationships, hierarchies, and calculated columns using DAX formulas.
- Relationship management
- DAX formula engine
- Calculated tables & columns
- Time intelligence functions
Sharing & Collaboration
Share insights securely across your organization with role-based access control and real-time collaboration.
- Workspace collaboration
- Row-level security
- Embedded analytics
- Teams integration
Mobile-First Design
Access your dashboards anywhere, anytime with native mobile apps optimized for iOS and Android devices.
- Touch-optimized interface
- Offline access
- Push notifications
- Responsive layouts
Real-World Dashboard Examples
See how Power BI transforms complex data into actionable insights across different business scenarios
Interactive demo (Sales, Purchase, Inventory, HR, Finance) — opens in a new tab.
$2.4M
12.5%34.2%
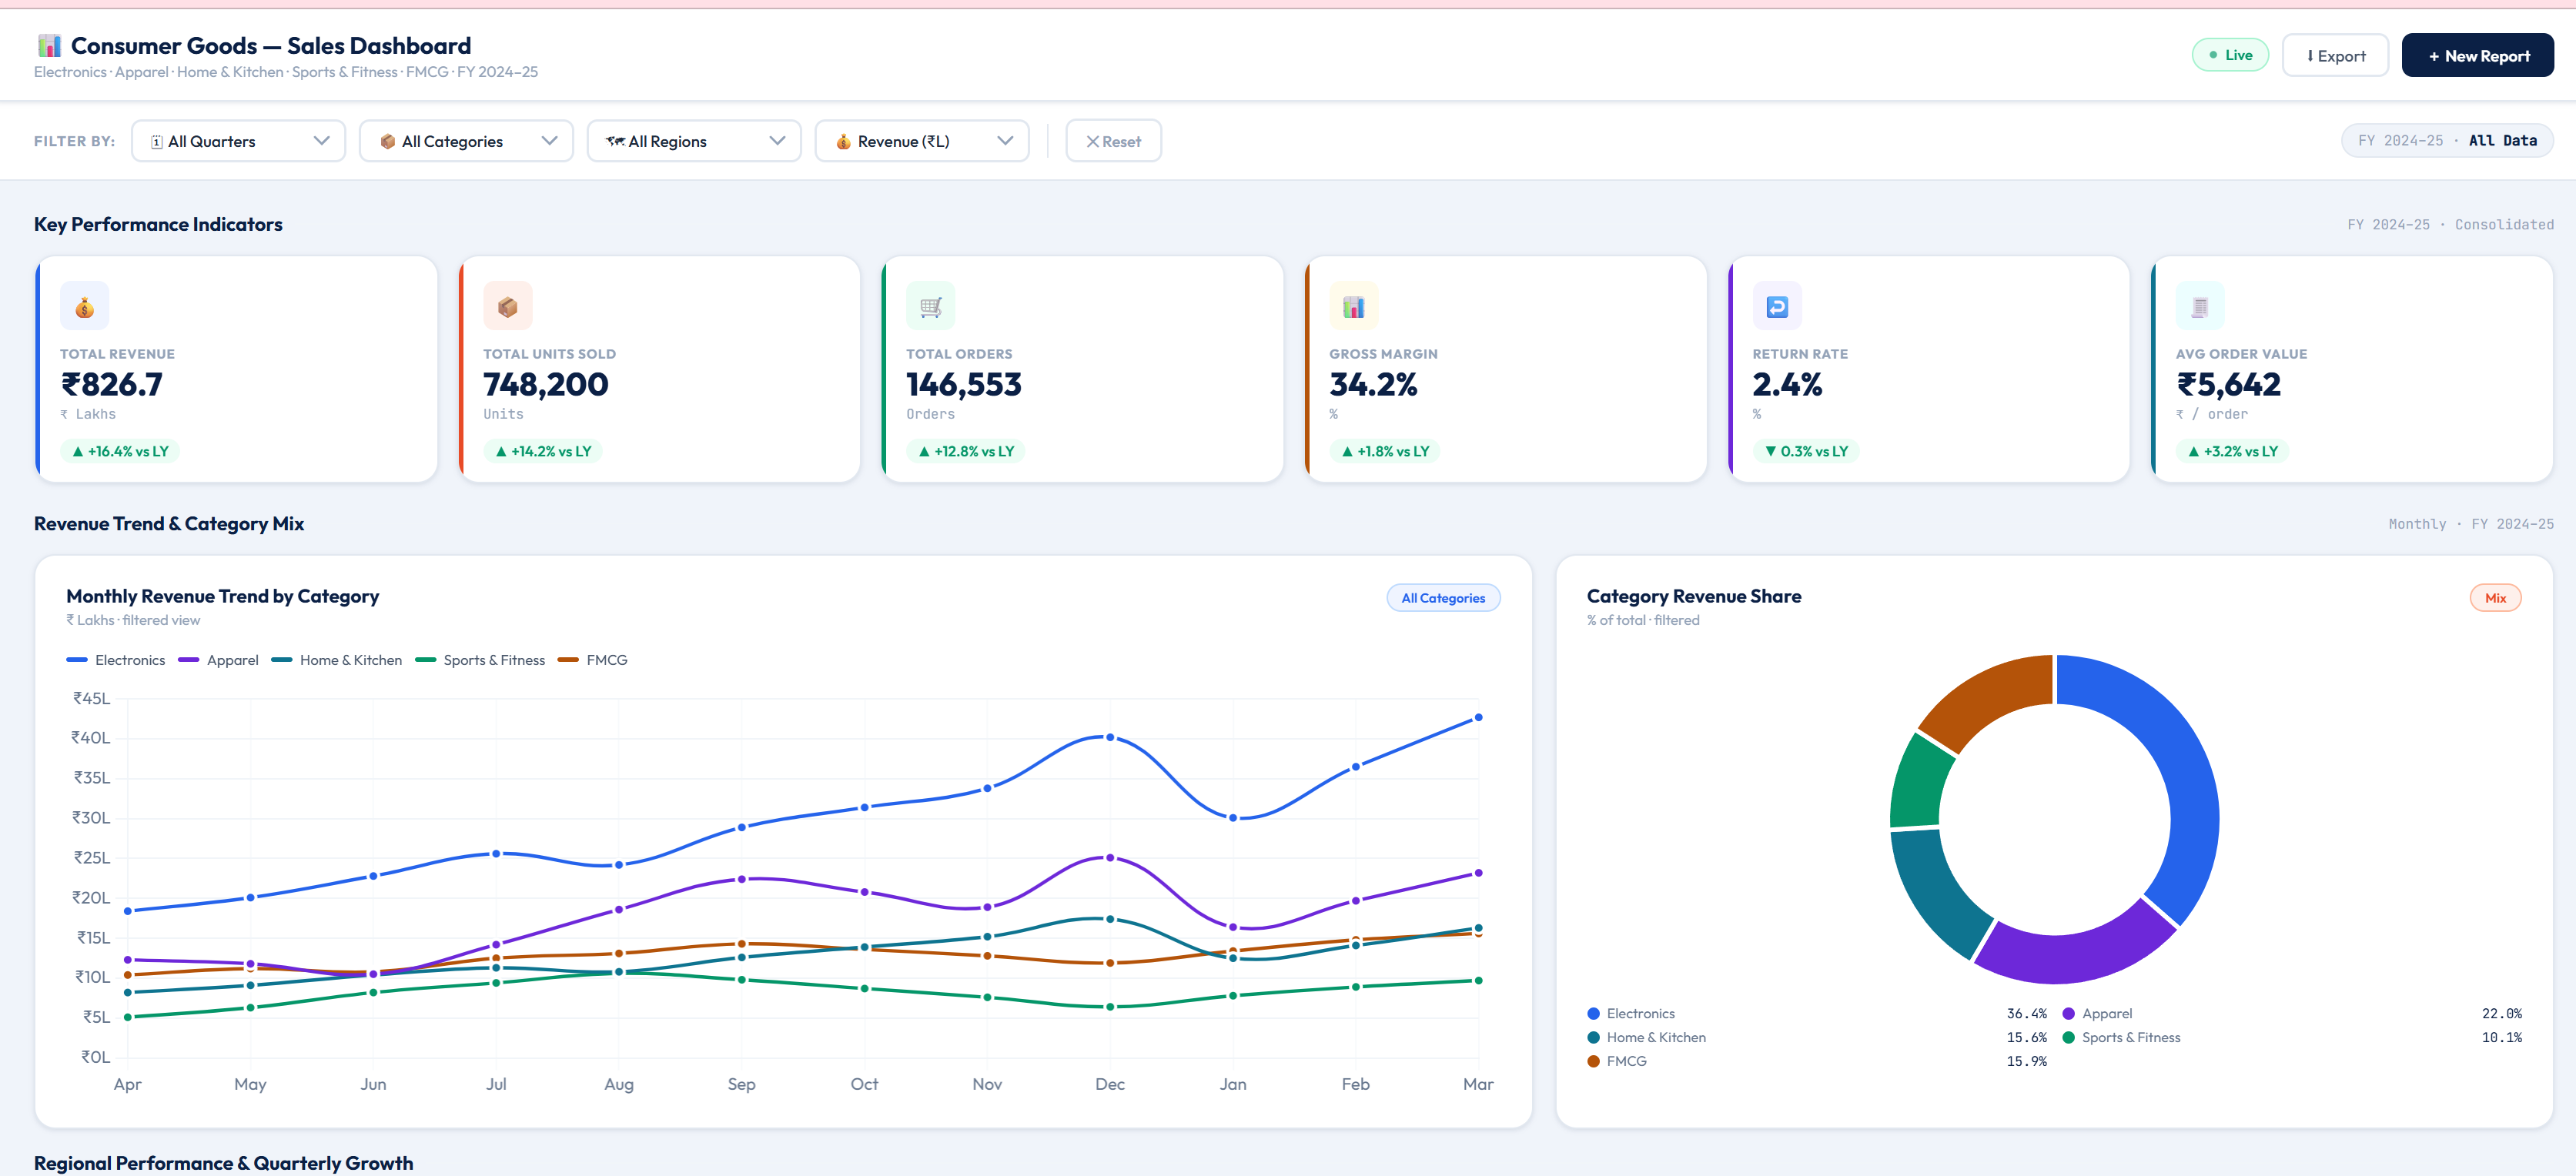
5.3%Sales Performance Dashboard
Track your sales metrics in real-time with comprehensive visualizations that help you identify trends, monitor team performance, and forecast future revenue.
Revenue Tracking
Monitor sales performance across regions, products, and time periodsSales Funnel Analysis
Visualize the customer journey from lead to conversionTeam Performance
Compare individual and team metrics to drive competition
$845K
8.2%22.4%
1.1%Financial Performance Dashboard
Gain complete visibility into your financial health with comprehensive P&L statements, cash flow analysis, and budget tracking.
P&L Analysis
Detailed profit and loss statements with drill-down capabilitiesCash Flow Monitoring
Track cash inflows and outflows in real-timeBudget vs Actual
Compare planned budgets against actual spending
1,247
5.2%8.3%
2.1%Human Resources Dashboard
Monitor workforce metrics, track employee engagement, and analyze recruitment efficiency to build a stronger organization.
Workforce Analytics
Track headcount, demographics, and organizational structureEngagement Tracking
Monitor employee satisfaction and engagement scoresRecruitment Metrics
Analyze time-to-hire, cost-per-hire, and source effectiveness
Visible
by SKU / locationTrends
aging & movementInventory & stock dashboard
See on-hand quantities, movement, and aging across warehouses so you can reduce stock-outs, cut excess inventory, and align purchasing with demand.
Multi-location stock
Roll up or drill down by site, bin, and productMovement & turnover
Track receipts, issues, and slow moversExceptions
Highlight negative stock, near-expiry, and reorder points
On track
visibility—
live refreshPurchases & procurement dashboard
Monitor purchase orders, supplier spend, and goods receipt against budgets—so finance and operations stay aligned.
Spend & PO tracking
See commitments, receipts, and variances by vendor and periodThree-way match views
Align purchase orders, receipts, and invoices where your data allowsSupplier performance
Track lead times, fill rates, and price trendsHow We Implement Power BI
Our proven methodology ensures a smooth transition to data-driven decision making
Discovery & Requirements
We begin by understanding your business objectives, data sources, and specific reporting needs through detailed consultation sessions.
Data Architecture Design
Our experts design a scalable data architecture that ensures optimal performance and maintainability of your dashboards.
Development & Configuration
We build your custom dashboards, configure data connections, and implement business logic using best practices and proven methodologies.
Testing & Validation
Rigorous testing ensures data accuracy, performance optimization, and user acceptance before deployment.
Deployment & Training
We deploy your dashboards to production and provide comprehensive training to ensure your team can leverage Power BI effectively.
Support & Optimization
Ongoing support and continuous improvement ensure your Power BI solution evolves with your business needs.
Benefits of Our Power BI Services
Partner with us to unlock the full potential of your data and drive business growth
Save Time
Automate reporting processes and reduce manual data compilation by up to 80%
Better Insights
Discover hidden patterns and trends with AI-powered analytics and visualizations
Faster Decisions
Access real-time data and make informed decisions with confidence and speed
Cost Savings
Reduce costs through improved operational efficiency and resource optimization
Ready to Transform Your Data?
Let's discuss how Power BI can revolutionize your business intelligence and drive data-driven decisions across your organization.
Or email us at:
gangab@dhanvitta.in